MatLab-6 program ALKRES1.m
This is the MatLab program, using the data from datahydrocarb.txt (called nor in the program):
%plotting and analysis of data from Kimball Calculations
%Normal, staggered hydrocarbons, ES August 1991
load -ascii nor.mat nor
i=1:52;
a(i)=nor(i,1);
b(i)=nor(i,2);
c(i)=nor(i,3);
d(i)=nor(i,4);
e(i)=nor(i,5);
f(i)=nor(i,6);
g(i)=nor(i,7);
h(i)=nor(i,8);
m(i)=nor(i,9);
j=2:2:52;
i=1:2:51;
k=1:26;
%
etot(k)=a(i);
vir(k)=d(i);
vnn(k)=b(i);
eel(k)=c(i);
T(k)=e(i);
V(k)=f(i);
vel(k)=g(i);
vee(k)=h(i);
vne(k)=m(i);
delh0(k)=m(j);
format long
p=polyfit(k,etot,1)
k1=0:26;
fit=polyval(p,k1);
v=[0,26,-3000,2000]; axis(v);
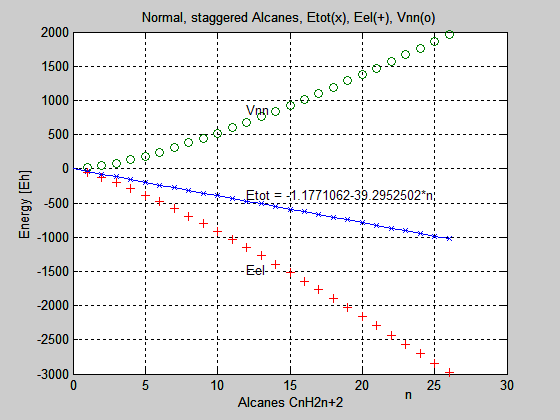
plot(k,etot,'x',k,vnn,'o',k,eel,'+')
hold
plot(k1,fit)
grid
title('Normal, staggered Alkanes, Etot(x), Eel(+), Vnn(o)')
xlabel(' Alkanes CnH2n+2')
ylabel('Energy [Eh]')
s=sprintf('Etot = %10.7f%11.7f*n',p(2),p(1));
text(12,-390,s)
text(12,850,'Vnn')
text(12,-1480,'Eel')
text(23,-3300,'n')
hold
%meta alres274
pause
hold off
sumv=vne+2*vnn;
diff=vee-vnn;
ratio(k)=-sumv(k)/diff(k);
p=polyfit(k,sumv,1);
k1=0:26;
fit1=polyval(p,k1);
q=polyfit(k,diff,1);
fit2=polyval(q,k1);
v=[0,26,-2500,500]; axis(v);
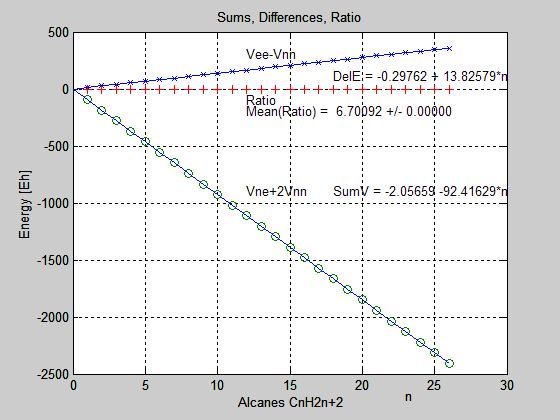
plot(k,diff,'x',k,sumv,'o',k,-ratio,'+')
hold
plot(k1,fit1)
plot(k1,fit2)
grid
title('Sums, Differences, Ratio')
xlabel(' Alkanes CnH2n+2')
ylabel('Energy [Eh]')
s=sprintf('DelE = %8.5f +%9.5f*n',q(2),q(1));
text(18,110,s)
s=sprintf('SumV = %8.5f%10.5f*n',p(2),p(1));
text(18,-900,s)
text(12,300,'Vee-Vnn')
text(12,-900,'Vne+2Vnn')
text(23,-2700,'n')
text(12,-100,'Ratio')
meanr=mean(ratio);
s=sprintf('Mean(Ratio) = %8.5f +/-%8.5f',meanr,std(ratio));
text(12,-200,s)
pause
%meta alres274
hold off